I’m an information designer at heart. But my experience, knowledge, and practical skills run broad and deep.
I'm also a journalist, art director, author, data visualizer, project manager, scientific illustrator, presenter, editorial designer, photo editor, print production expert, and science communicator.
In short, I’m a problem solver.
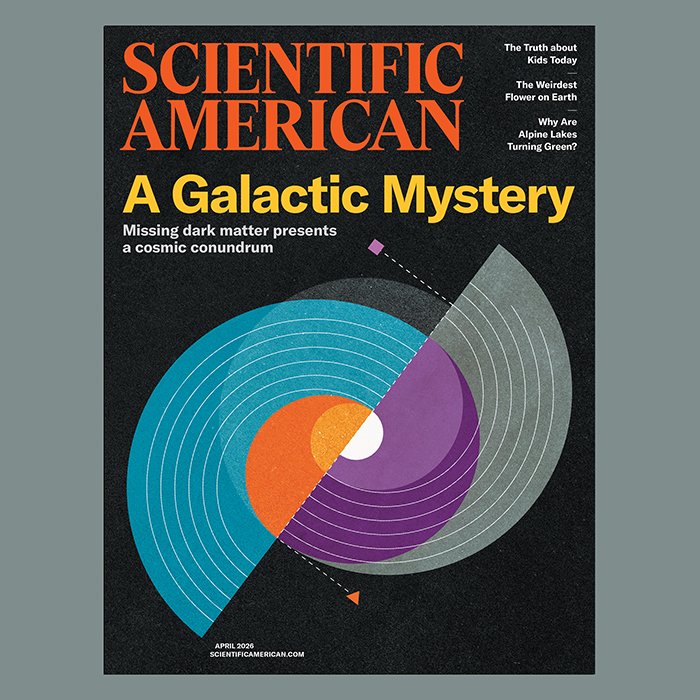
I cut my teeth at Scientific American, honed craft at National Geographic, managed my own business as an independent visual science communicator, returned to Scientific American, became a sought-after presenter, and wrote the book on science graphics.
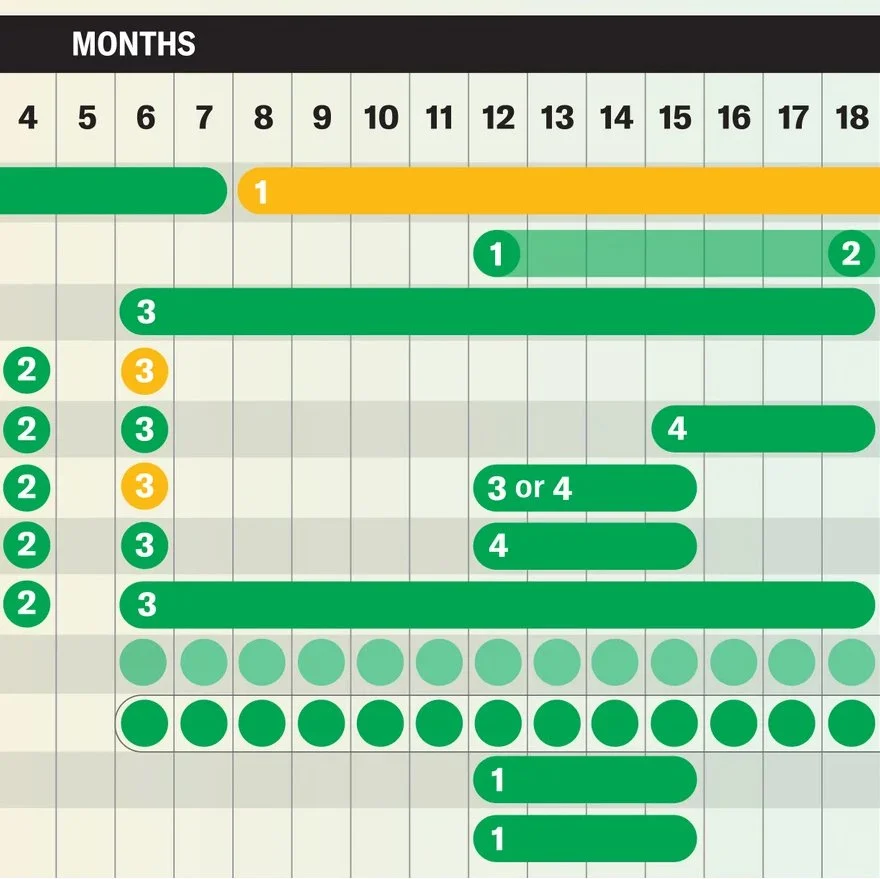
In my current role as a graphics editor, I produce illustrated explanatory diagrams and data visualizations. I love to read and think and write and talk about ways that we can all get better at conveying science-centric content with visuals.

Interested in collaborating?
Featured Projects